In a complicated mix of networks, browsers, devices, and runtime conditions, self-testing, QA, and code review are not enough. If a page has high requirements for stability and correctness, front-end code needs a complete error monitoring system. The problem is not only how to catch exceptions, but also how to collect useful logs, reduce noise, locate failures in production code, and decide when an error deserves an alert.
Common ways to collect front-end error logs
Front-end error collection usually falls into two categories. One is explicit checks written into business logic, where the code actively decides that something is wrong. The other relies on language or browser mechanisms to intercept exceptions more aggressively, such as try..catch and window.onerror.
Active checks in business logic
After a calculation or a state transition, the result may not match what the program expects. In that case, the code can report the problem directly:
// test.js
function calc(){
  // code...
  return val;
}
if(calc() !== "someVal"){
  Reporter.send({
    position: "test.js::<function>calc"
    msg: "calc error"
  });
}
This kind of reporting is best suited to logic errors and state errors. It is especially common when checking an API response status, because the code usually knows what a valid response should look like.
Catching exceptions with try..catch
When a block of code may throw synchronously, try..catch can wrap it and report the exception:
try {
  init();
  // code...
} catch(e){
  Reporter.send(format(e));
}
If init is the entry point of the program, synchronous errors that occur during that execution path can be caught. This also prevents the application from crashing immediately after startup.
Global collection with window.onerror
A more global approach is to listen for uncaught errors on window:
window.onerror = function() {
  var errInfo = format(arguments);
  Reporter.send(errInfo);
  return true;
};
Returning true prevents the error from being printed to the console. The callback receives the following information:
/**
 * @param {String} errorMessage  错误信息
 * @param {String} scriptURI     出错的文件
 * @param {Long} lineNumber      出错代码的行号
 * @param {Long} columnNumber    出错代码的列号
 * @param {Object} errorObj      错误的详细信息,Anything
 */
window.onerror = function(errorMessage, scriptURI, lineNumber,columnNumber,errorObj) {
  // code..
}
window.onerror is a fairly forceful fault-tolerance mechanism, and try..catch is similar in spirit. Conceptually, once an error is detected, the runtime jumps out of the current execution path to the top-level handler or the nearest catch layer, regardless of how deep the current stack is. It is useful, but this kind of “kick the error away” handling is not always a good design.
Problems that appear during log collection
The purpose of logging is not just to know that something failed. A useful log should tell us where the error happened. A better one should also help us understand how to handle it. The most difficult goal is automatic fault tolerance: detect the error and recover from it without human intervention.
Cross-origin scripts and the unhelpful Script error.
Consider this page:
<!-- http://barret/test.html -->
<script>
window.onerror = function(){
  console.log(arguments);
};
</script>
<script src="https://barret/test.js"></script>
And this script:
// http://barret/test.js
function test(){
  ver a = 1;
  return a+1;
}
test();
What we hope to collect is a detailed error report with a message, file, line number, and column number:
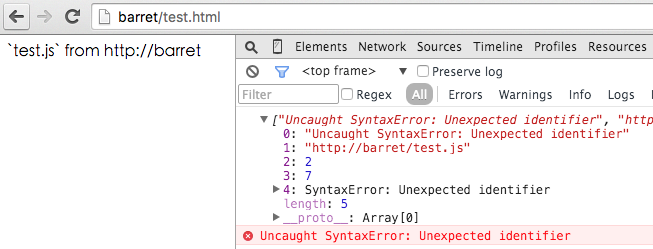
In real production systems, static resources are often served from another domain for better distribution and management:
<!-- http://barret/test.html -->
<script>
window.onerror = function(){
  console.log(arguments);
};
</script>
<script src="https://localhost/test.js"></script>
But the collected result becomes much less useful:
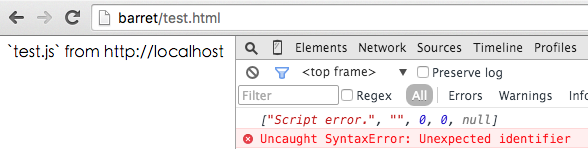
In Chromium’s WebCore code, the relevant behavior can be seen in the script execution context:

When the script is cross-origin, the browser returns Script error. instead of exposing details.
// http://trac.webkit.org/browser/branches/chromium/1453/Source/WebCore/dom/ScriptExecutionContext.cpp#L333
String message = errorMessage;
int line = lineNumber;
String sourceName = sourceURL;
// 已经拿到了所有的错误信息,但如果发现是非同源情况,`sanitizeScriptError` 中复写错误信息
sanitizeScriptError(message, line, sourceName, cachedScript);
Older WebCore logic only checked securityOrigin()->canRequest(targetURL). Newer versions also include a cachedScript check, which shows that browsers have become stricter about exposing cross-origin script error details.
A local test also shows the limitation:
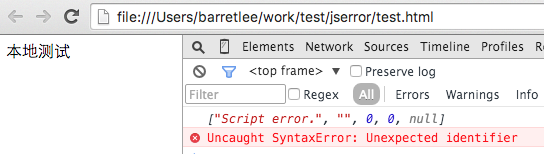
Under the file:// protocol, securityOrigin()->canRequest(targetURL) is also false.
Why does the browser hide the details and return only Script error.? The reason is data leakage prevention. A simple example makes this clear:
<script src="bank.com/login.html"></script>
This does not load a JavaScript file. It loads a bank login page as a script. If the user is already logged in, the page might redirect to something like Welcome xxx...; otherwise it might show Please Login.... If the browser exposed the resulting JavaScript error, the message could become Welcome xxx... is not defined or Please Login... is not defined. That would allow another site to infer whether the user is logged into the bank, which is clearly unsafe.
Using crossorigin to pass the cross-origin restriction
Both img and script tags support the crossorigin attribute. It tells the browser that the page is intentionally loading an external resource and trusts it:
<script src="https://localhost/test.js" crossorigin=""></script>
However, that alone is not enough:
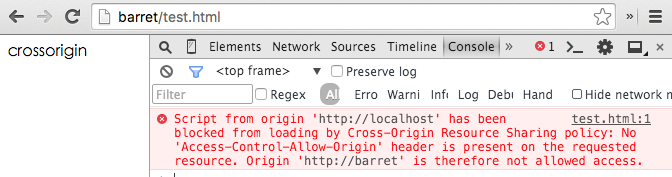
This error is expected. Cross-origin resource sharing requires the server to also send an Access-Control-Allow-Origin response header:
header('Access-Control-Allow-Origin: *');
Many CDN-hosted static assets already include CORS headers for JavaScript, CSS, images, fonts, SWF files, and similar resources:
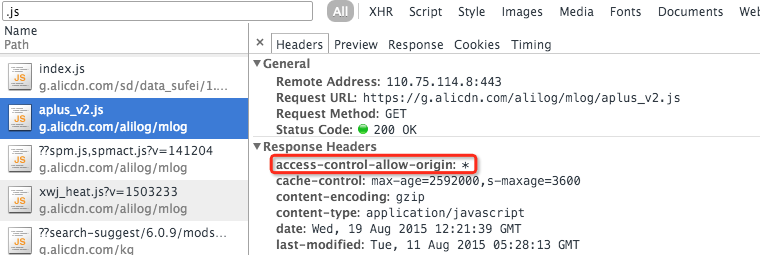
Without this two-sided cooperation—the crossorigin attribute on the tag and the CORS header from the server—front-end error logs from cross-origin scripts will often be reduced to Script error..
Minified production code is hard to locate
Production JavaScript is almost always bundled and minified. Dozens or even hundreds of files may be combined into one file, and the final output often has only a single line. When the log says a is not defined, and the error happens only in a specific scenario, it may be impossible to know what the compressed variable a originally meant. In that case, the error log is effectively useless.
A natural first thought is source maps. A source map can map a location in minified code back to the original source file. A common source map reference is placed at the end of the file:
//# sourceMappingURL=index.js.map
Older formats used //@; newer ones use //#. But for error reporting, this is not automatically helpful. JavaScript code does not directly get the original line number; tools such as Chrome DevTools perform the mapping during debugging. In addition, not every production resource includes a source map. For many projects, source maps remain mainly useful during development.
It is possible in theory to parse the VLQ encoding and position mapping rules in source maps, then post-process collected logs and map them back to original source locations. But the implementation cost is high.
A cheaper method is to reduce the search area during bundling. For example, when concatenating files, insert 1000 blank lines between each file:
(function(){var longCode.....})(); // file 1
// 1000 个空行
(function(){var longCode.....})(); // file 2
// 1000 个空行
(function(){var longCode.....})(); // file 3
// 1000 个空行
(function(){var longCode.....})(); // file 4
var _fileConfig = ['file 1', 'file 2', 'file 3', 'file 4']
If the error is reported on line 3001, the handler can roughly identify the third source file:
window.onerror = function(msg, url, line, col, error){
  // line = 3001
  var lineNum = line;
  console.log("错误位置:" + _fileConfig[parseInt(lineNum / 1000) - 1]);
  // -> "错误位置:file 3"
};
This does not give an exact statement, but it narrows the search range dramatically.
Registering error handlers
Registering the same error handler multiple times does not necessarily result in duplicate callback execution:
var fn = window.onerror = function() {
  console.log(arguments);
};
window.addEventListener("error", fn);
window.addEventListener("error", fn);
After an error is triggered, both window.onerror and the addEventListener handler run, but the duplicated listener runs only once:
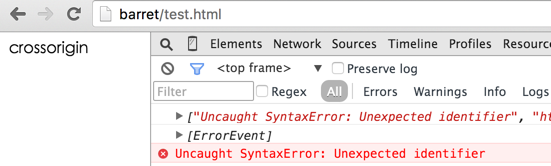
This matters when building shared monitoring code, because duplicate registration is easy to introduce during initialization.
Controlling log volume
Not every error should be sent to the logging backend. The volume can become enormous. If a page has 10 million PVs and a deterministic error occurs for every request, the system will receive 10 million log entries—roughly a gigabyte of logs for that single issue.
The reporting function should support sampling:
function needReport (sampling){
  // sampling: 0 - 1
  return Math.random()
}
Sampling can be implemented in several ways. It can use a random number, a specific field in a cookie such as the last character of a nickname, or a hash of the nickname followed by a decision based on the last digit or letter. The key point is to reduce volume while preserving enough data to observe trends and locate major problems.
Where to place logging points
To collect more accurate and useful error information, active instrumentation is usually better than waiting for global exceptions. For example, in an API request:
// Module A Get Shops Data
$.ajax({
  url: URL,
  dataType: "jsonp",
  success: function(ret) {
    if(ret.status === "failed") {
      // 埋点 1
      return Reporter.send({
        category: "WARN",
        msg: "Module_A_GET_SHOPS_DATA_FAILED"
      });
    }
    if(!ret.data || !ret.data.length) {
      // 埋点 2
      return Reporter.send({
        category: "WARN",
        msg: "Module_A_GET_SHOPS_DATA_EMPTY"
      });
    }
  },
  error: function() {
    // 埋点 3
    Reporter.send({
      category: "ERROR",
      msg: "Module_A_GET_SHOPS_DATA_ERROR"
    });
  }
});
These three reporting points are precise and self-describing. They make later production debugging much easier because they distinguish between an API returning a failure status, returning no usable data, and the request itself failing.
When to use try..catch
try..catch should be used sparingly. Most JavaScript code is written by the team itself, so the places where problems may occur should usually be understood in advance. In daily work, try..catch is most often needed for cases that are not fully controllable, such as parsing unknown JSON or decoding a string that may contain invalid characters:
// JSON 格式不对
try{
  JSON.parse(JSONString);
}catch(e){}

// 存在不可 decode 的字符
try{
  decodeComponentURI(string);
}catch(e){}
Even in these places, it is worth asking whether compatibility or validation can be handled in another way. try..catch is useful, but it should not replace clear state checks and explicit error handling.
Placement of window.onerror
The global error handler must be registered as early as possible. Consider this code:
// test.js
throw new Error("SHOW ME");
window.onerror = function(){
  console.log(arguments);
  // 阻止在控制台中打印错误信息
  return true;
};
The script throws immediately and does not continue to the handler registration. A page may contain multiple script tags, but the window.onerror listener should be placed before the scripts whose errors it is expected to capture.
Alerting: when should an error trigger a warning?
Not every error deserves an alert. Complex pages operating under varied network and browser environments may tolerate a small error rate, such as one in a thousand. Alerting should be based on processed log data, not individual errors.
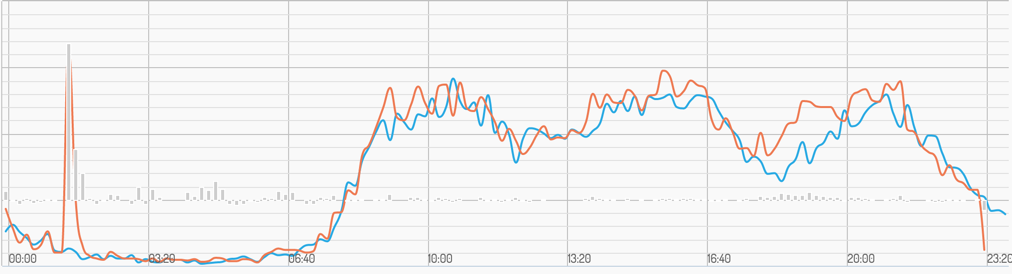
In the chart, the orange line represents today’s data, and the light blue line represents the historical average. A data point is generated every 10 minutes. The x-axis is the 0–24 hour timeline, and the y-axis is the number of errors. Around 1–2 a.m., the error count rises to more than ten times the average, which is the kind of situation where an alert is appropriate.
Alert rules should be strict enough to avoid false alarms. False positives are frustrating, especially when they arrive as SMS messages, emails, or app notifications late at night. Reasonable alert conditions include:
- The error count exceeds a threshold, such as more than 100 errors in 10 minutes.
- The error count exceeds 10 times the historical average. Alerting merely because the count is above average is not reasonable, but reaching 10 times the average strongly suggests a service problem.
- Before comparison, repeated errors from the same IP should be filtered. For example, an error inside a
forloop orwhileloop may produce a flood of reports from one user. Another example is a user repeatedly refreshing during a flash-sale scenario.
Friendly and actionable error messages
Compare these two logs.
A raw caught exception:
Uncaught ReferenceError: vd is not defined
A custom structured log:
"生日模块中获取后端接口信息时,eval 解析出错,错误内容为:vd is not defined." 该错误在最近 10 分钟内出现 1000 次,这个错误往日的平均出错量是 50 次 / 10 分钟
The second version is far more useful. It explains the module, the operation, the failing step, the original error, the recent frequency, and the historical baseline. That is the difference between knowing that something broke and knowing where to begin investigating.
Network Error Logging
The W3C Web Performance Working Group published a working draft for Network Error Logging. The document defines a mechanism that allows websites to declare a network error reporting policy. User agents such as browsers can then use that policy to report network errors that affect correct resource loading. It also defines a standard error report format and a transport mechanism between browsers and web servers.
Draft: http://www.w3.org/TR/2015/WD-network-error-logging-20150305/
Monitoring is part of engineering
Feature development, testing, and monitoring are three essential parts of software engineering. Many engineers are comfortable building features and have some understanding of testing, but monitoring is often treated as an afterthought. Error log collection and processing are only one part of monitoring, yet they are critical for understanding the real stability of a website in production.